
The effective resolution of design or any other problems relies heavily on putting the various criteria in some order of comparative priority and a simple system by Bruce Archer (UK) in the 1960s gave me a clue as to how to do this in some numerical way. Complex problems have many characteristics or criteria, each of which must be compared for priority against all the others – a time consuming process – which has been simplified by the above chart. Over my designing years I have used this system many times and developed it much further into a selection system which can be used in many ways – selecting a new car or block of land, anything of enough value to make the effort of resolution worth it.
It is of great value in resolving a very complex mass of data, some of which are very subjective and unquantifiable but nevertheless of great importance as criteria which have to be reconciled with very objective and quantifiable facts which are usually difficult to compare.
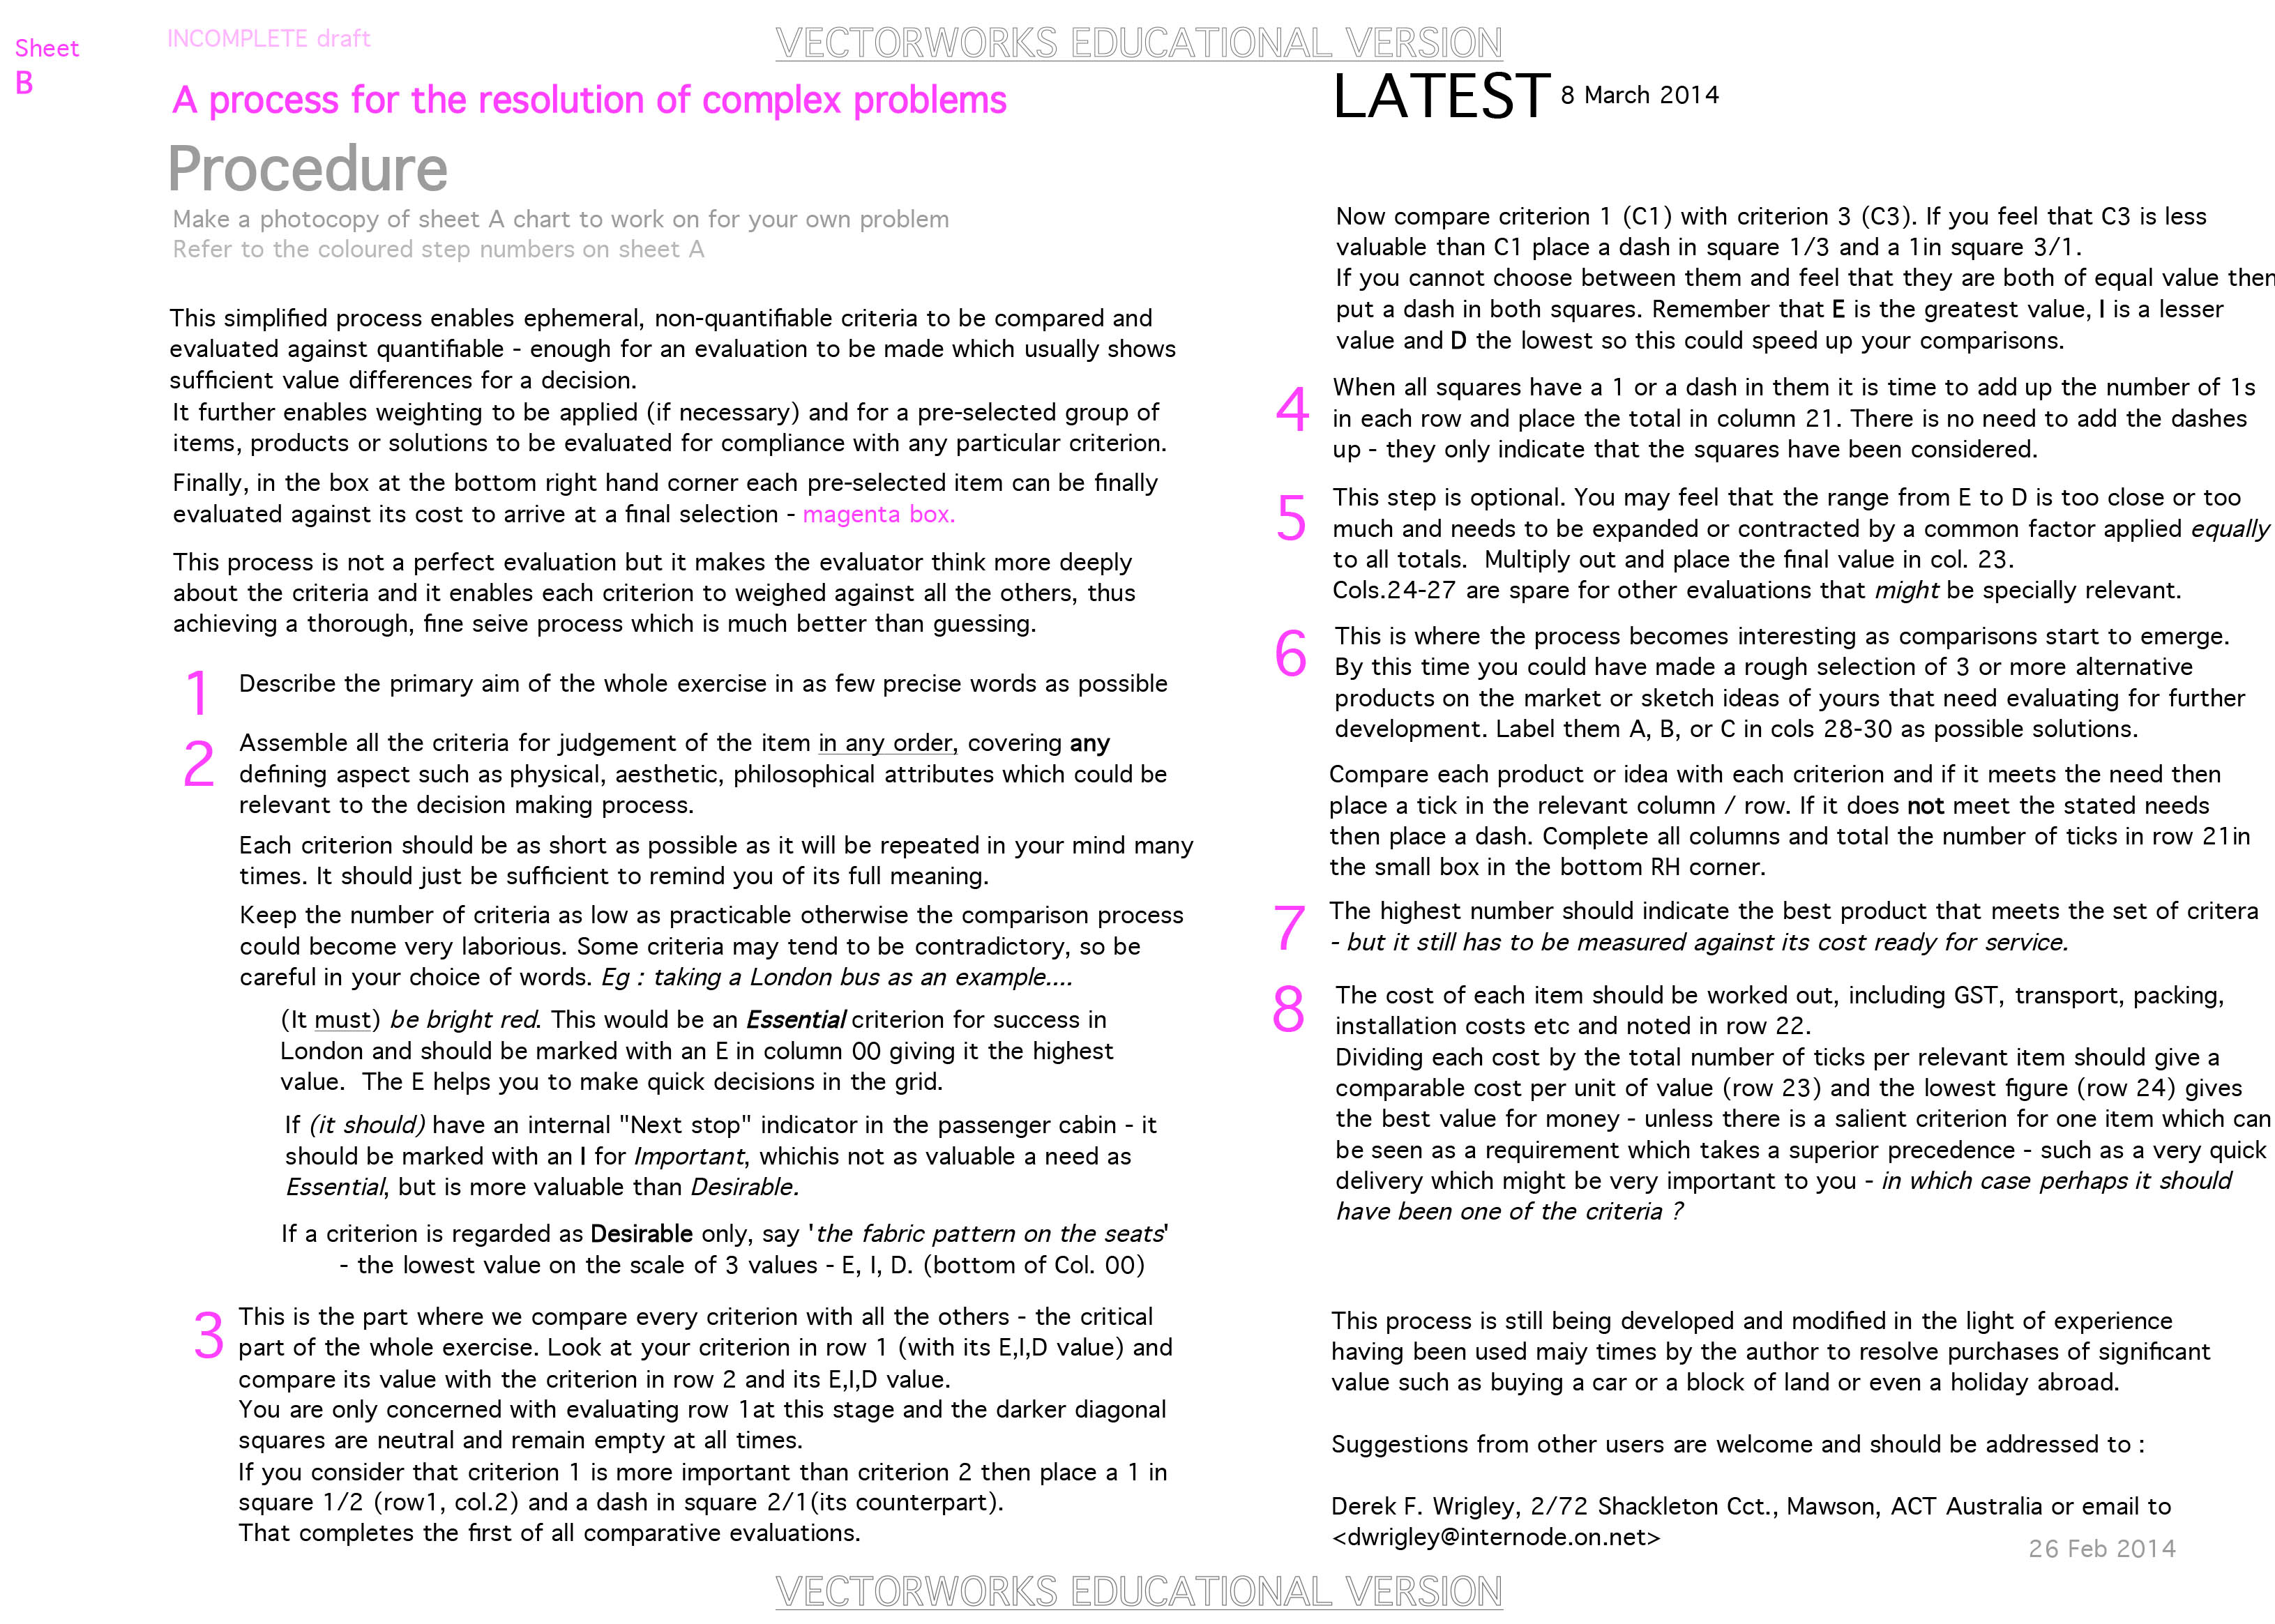
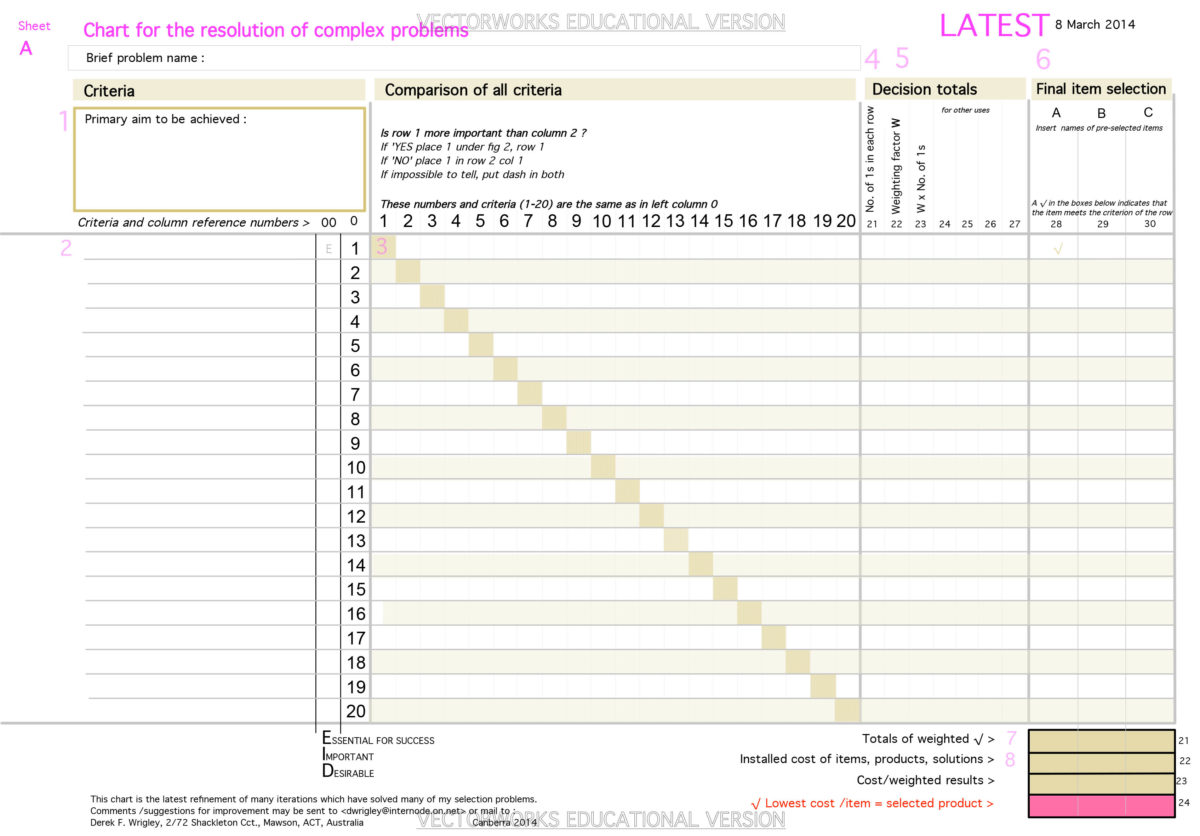
The comparative analysis can take time but is the key to effective analysis – “garbage in = garbage out” but it is as solid a base for ongoing decisions as you are ever likely to obtain in (col.21).
Weighting of the compared figures may or may not be necessary (col.22), depending on circumstances to arrive at figures you will be using to select potential answers in (cols. 28,29,30). Follow the steps below which describe the pink numbered areas above. PROBSOLV B .pdf